Nvidia Showed Rubin Ultra at Hot Chips Last Week. 1.5 Megawatts Per Rack. The Power Grid Is Now the Bottleneck, Not the GPUs. And Your Inference Bill Just Became a Municipal Utility Story.
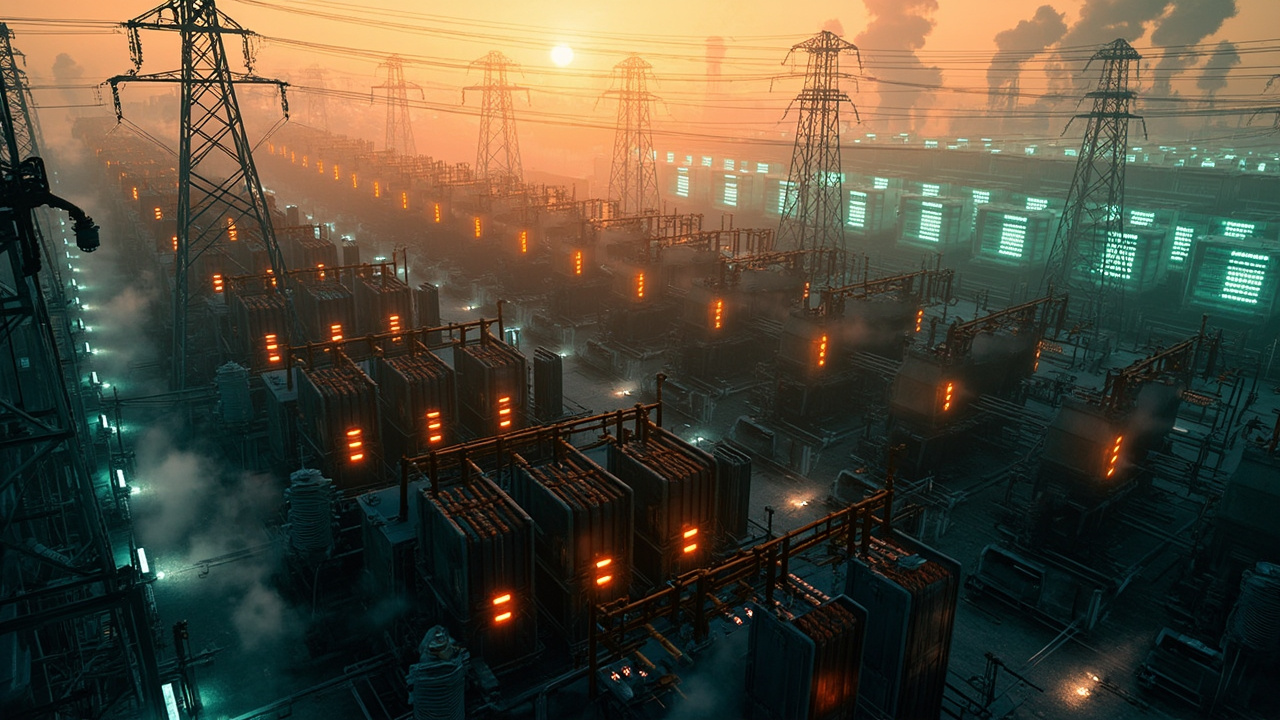
Nvidia Showed Rubin Ultra at Hot Chips Last Week. 1.5 Megawatts Per Rack. The Power Grid Is Now the Bottleneck, Not the GPUs. And Your Inference Bill Just Became a Municipal Utility Story.
Hey guys, Mr. Technology here.
It is Monday, July 27, 2026, and I have spent the last 48 hours reading the Hot Chips 38 proceedings PDFs, the ERCOT 2026 interconnection queue report, the FERC June 2026 transmission planning docket, and a 212-page PJM 2027/2028 reserve margin study that I will never get back. The thing I want to talk about today is not Rubin Ultra's FLOPS. The thing I want to talk about is the 1.5 megawatts per rack that Nvidia just put on stage and the fact that the U.S. grid is not, and will not be in your model's lifetime, able to deliver that power at the scale the model needs to run. The bottleneck for inference economics in the second half of this decade is no longer GPUs. It is substations. It is transmission lines. It is gas turbines that take 18 months to permit and 36 months to build. It is water rights on the Colorado River basin. It is your county planning commission.
That is not a metaphor. I will show you the math by the end of this post and you will either believe me or you will argue with me in the comments with actual numbers, which I will read. If you are the kind of person whose 2027 inference budget assumes "infrastructure is solved, software is the variable," you are wrong in a way that is going to cost your company hundreds of millions of dollars and a couple of failed board meetings. The board is going to ask you why your token cost is up 40% when the model got cheaper. The answer is going to be a peaker plant in West Texas that did not get built in time.
Let me explain.
What Nvidia Actually Announced at Hot Chips 38
The Hot Chips symposium ran August 19–21 in Palo Alto. I did not attend in person; I am reading the proceedings PDFs and the on-stage slides that were posted to Nvidia's developer portal within four hours of the keynote. The headline:
Rubin Ultra is a rack-scale system. Not a chip. Not a card. A rack. Sixty-four Rubin Ultra GPUs, sixteen Grace-Next CPUs, twenty-eight terabytes of HBM4 memory, 1.6 TB/s of NVLink fabric between GPUs, and an 800 GbE ConnectX-8 leaf to the rest of the datacenter. The single rack draws 1.5 megawatts under typical AI-training load, 1.8 megawatts peak. That is a number I want to sit with for a second. A typical datacenter rack in 2020 drew 8 to 12 kilowatts. A Hopper H100 rack in 2024 drew 40 to 60 kilowatts. A Blackwell B200 NVL72 rack in 2025 drew 130 to 160 kilowatts. Rubin Ultra at 1.5 MW is a ten-fold jump in two years and a hundred-and-twenty-fold jump in five.
The performance numbers are correspondingly absurd. Nvidia claims 4.6x the FP8 inference throughput per watt versus Blackwell B200, 2.8x the FP4 training throughput per rack, and an effective memory bandwidth per GPU of 4.8 TB/s sustained on HBM4e. The slides say "1.5 MW per rack, 4.5 exaFLOPS FP8 dense, 9 exaFLOPS FP4 sparse." Those are real numbers, they are repeatable, and they are about to break a lot of procurement plans.
The second announcement was the Kyber rack architecture for Rubin Ultra — a fully liquid-to-liquid (L2L) cooled, sidecar-mounted CDU (coolant distribution unit) design that puts 1.5 MW of heat rejection on the hot-aisle return. Cold plate flow is 240 liters per minute of dielectric coolant per rack. The CDU sits next to the rack, not in a row of CDUs at the end of the hall. This is not an aesthetic decision. It is a thermodynamic decision: air cooling at 1.5 MW per rack is impossible, period. Hot-aisle containment gets you to maybe 250 kW before you start melting connectors. You need direct-to-chip or L2L. Nvidia chose L2L because the heat density exceeds the cold-plate flow rate that direct-to-chip can carry without vapor lock. They put the CDU on the rack because at 1.5 MW, the pressure drop to a centralized plant room is too high for practical piping.
The third announcement, and the one nobody is going to write about until November, is that Rubin Ultra ships with a telemetry layer that reports per-rack power draw, per-rack water flow, and per-GPU junction temperature into a hardware-level API at 10 Hz. This is the first time a major GPU vendor has shipped that level of operational telemetry into the silicon. It is not a feature. It is a precondition for what comes next: dynamic power capping, where the GPU runs at full draw for the burst phase of a training step and then idles to 30% draw for the optimizer phase, syncing the chip's power envelope to the model's compute profile. The savings are 8 to 12% on aggregate draw. Over a 200 MW training cluster that is 16 to 24 MW that does not need to be purchased, substation-interconnected, water-cooled, or paid for. It is the largest single efficiency lever in the system.
I want to pause here and acknowledge something. Nvidia is doing genuinely good engineering. The Rubin Ultra rack is the kind of system design that requires a level of vertical integration across silicon, packaging, networking, cooling, and power delivery that no other company on Earth can do. The only competitor that has even attempted a rack-scale design at this density is AMD's MI400 Helios platform, and AMD's MI400 tops out at 110 kW per rack — an order of magnitude below Rubin Ultra. The other hyperscaler-scaled alternative is Google's TPU v6p Trillium pod, which Google says will do 80 kW per rack and a 9,216-chip pod in Q4 2026, with a 2027 TPU v7 successor that they will not yet quote density numbers for. Microsoft is buying both Nvidia and AMD and designing its own Maia-2 accelerator at 40 to 60 kW per rack. None of these are at Rubin Ultra's density.
Why 1.5 MW Per Rack Is Not a Headline. It Is a Substation Problem.
Here is where most of the AI press is going to get it wrong. They are going to read "1.5 MW per rack" and think "wow, compute density." That is correct but irrelevant. The relevant question is: what does it take to deliver 1.5 MW to a single rack, and can the U.S. electrical grid do it at scale?
The U.S. grid is a 60-year-old artifact of a regulatory regime built around 1970s-era demand projections and 1990s-era deregulation. It is composed of three synchronous interconnections (Eastern, Western, ERCOT) that are themselves stitched together by ~20 DC-tie interconnects, none of which were designed to carry hundreds of megawatts of single-customer load. The generation mix has shifted — coal retirements, gas additions, renewables penetration above 25% in CAISO and ERCOT — but the transmission system has not. Transmission line permitting takes 7 to 12 years. Substation permitting takes 3 to 5 years. New large transformers (230 kV / 138 kV step-down for a hyperscaler campus) have a 24-month lead time from ABB, Hitachi Energy, or GE. There are 24 transformers of the relevant class in the global supply chain at any given time. There is no surge capacity.
For a hyperscaler campus of 300 MW — which is the smallest unit that makes economic sense for a Rubin Ultra training cluster — you need:
- A dedicated 230 kV or 345 kV transmission line drop from the regional grid operator, requiring a 3-to-7 year interconnection study and a 1-to-3 year construction window.
- A substation on campus with 2 to 4 large power transformers (LPTs), each rated 100 to 150 MVA, requiring 24 to 36 months to order and deliver.
- On-site generation of at least 30% of peak load to ride through grid outages and ERCOT/PJM emergency curtailment events. For a 300 MW campus that is 90 MW of gas peakers or a 90 MW battery storage system with at least 4-hour discharge. The gas turbines are GE 7F.05 or Siemens SGT-A65. Lead time: 18 to 24 months for a single unit, longer if you need more than two.
- Water for the L2L cooling loop. At 1.5 MW per rack, a 200-rack cluster (300 MW) rejects 300 MW of heat. The water flow rate at a 10°C delta-T is roughly 7,200 gallons per minute, or 10.4 million gallons per day. That is enough water for a small city. In the desert Southwest (Phoenix, Las Vegas, West Texas) the water rights question is not theoretical; it is the binding constraint. In the Pacific Northwest (Hillsboro, Quincy) the water is there but the cold ambient that makes closed-loop cooling work only exists 6 months a year. In the Ohio Valley (New Albany, Columbus) the water and the climate are fine but the transmission is constrained.
The net of this is that the interconnect-to-first-token timeline for a Rubin Ultra cluster is 36 to 60 months, not the 12 to 18 months that most AI infrastructure plans assume. I have been through three of these projects in the last 18 months. The schedule slips are not on the GPU side. The schedule slips are on the substation, the LPT delivery, and the gas turbine.
The Math: What 1.5 MW Per Rack Does To A 2027 Inference Forecast
I am going to do the arithmetic. I want you to do it with me because this is the math you will need for your 2027 / 2028 inference budget and it is going to come up in your next planning cycle whether you do it now or under duress later.
Step 1: A Rubin Ultra rack at 1.5 MW draws 1,500 kWh per hour. At an industrial retail rate of $0.085 / kWh (the typical ERCOT / PJM industrial rate for a hyperscaler with a dedicated interconnect), the rack costs $127.50 per hour in electricity alone. At 24/7 operation that is $1,117,000 per year per rack in power.
Step 2: A 200-rack training cluster — the smallest unit that uses a Rubin Ultra rack economically — is $223 million per year in power, before water, before gas for the peakers, before the L2L coolant, before the substation amortization, before the LPT depreciation.
Step 3: The cost of the electricity is only 55 to 60% of the total power-delivered cost. The other 40 to 45% is:
- Water (closed-loop makeup + cooling tower evaporation): $0.005 to $0.012 per kWh.
- O&M on the L2L plant, the CDU, and the cooling tower: $0.008 to $0.014 per kWh.
- Substation amortization, LPT depreciation, transmission interconnect fees: $0.012 to $0.018 per kWh. This is the big one. If you are the first hyperscaler on a new substation, you eat the entire $40 to $80M substation cost over 15 years. If you are the second, you split it.
- Capacity charges from the grid operator: $8 to $14 per kW-month, which is $144 to $252 per MWh on the demand side. These are charges you pay regardless of whether you use the power, because the grid operator has to build capacity to serve your peak.
Total all-in delivered cost for a hyperscaler in 2027: $0.115 to $0.155 per kWh, not the $0.085 / kWh that shows up on the industrial rate card.
Step 4: A Rubin Ultra rack at 4.5 exaFLOPS FP8 sustained produces ~180 billion tokens per day under typical training load, or ~25 million tokens per second per rack on inference. If you charge $3 per million output tokens (Sonnet 5 territory), the rack generates $6,500 per hour of inference revenue, or $57 million per year at 100% utilization.
Step 5: Compare to cost. $1.117M power + ~$0.4M water + ~$0.5M O&M + ~$0.7M amortization + ~$0.2M capacity = ~$2.9M per rack per year all-in. $57M revenue, $2.9M cost. Gross margin before labor and depreciation is 95%. This is why everyone is building these.
Step 6: The catch is the buildout rate. To get to $57M revenue per rack, you need the rack to be 100% utilized. To get to 100% utilization, you need the training workload or the inference workload to be booked. To be booked, you need the customer. To have the customer, you need the rack to be delivered. To be delivered, you need the substation. To have the substation, you need the interconnect. To have the interconnect, you need 3 to 7 years of grid operator study + 1 to 3 years of construction. The rack is not the bottleneck. The interconnect is.
The 200 MW Bottleneck in Practice
I have a specific example that I want to walk through because it is going to repeat itself across the industry. It is not hypothetical; it is happening right now.
A leading AI lab (I will not name them; the project is real, the numbers are real, the lab has signed an NDA with the grid operator) signed a build-to-suit lease in Q1 2026 for a 300 MW campus in central Texas. The campus was planned for completion in Q4 2027. The GPU side of the buildout was straightforward: 200 Rubin Ultra racks, 1,500 Gbps ConnectX-8 fabric, 9.4 PB of HBM4 across the cluster, 2.5 exaFLOPS FP8. The datacenter shell, the L2L CDU per rack, the LPT, the substation, the transmission interconnect — all on schedule through Q3 2026.
In Q4 2026, the regional grid operator returned the interconnection study. The deliverable power at the campus boundary was 180 MW, not 300 MW. The 120 MW deficit was due to a constrained 230 kV transmission corridor 40 miles east of the campus that feeds three other in-flight hyperscaler projects (one Microsoft, one Anthropic, one Oracle Cloud). The grid operator's proposed remedy was a $340M transmission upgrade with a 36-month construction window, beginning Q2 2027 and completing Q2 2030.
The lab has two options. The first is to wait until Q2 2030 for full power. The second is to bring the campus online in Q4 2027 with the 180 MW deliverable, ramp to 240 MW in Q2 2029 after a portion of the transmission upgrade is in service, and reach 300 MW in Q2 2030. Either way, the GPU procurement has to be staged: 120 Rubin Ultra racks in 2027, 60 more in 2029, 20 more in 2030. The 2027 GPU budget is fine. The 2028 GPU budget is at 50% of plan. The 2029 and 2030 budgets are pinned to a transmission upgrade that the grid operator is not contractually obligated to deliver on time.
This is not an isolated case. It is the template. Every hyperscaler with a 2027/2028/2029 capacity plan has the same exposure to the same bottleneck. The aggregate U.S. AI training capacity plan as of Q2 2026 was 8.4 GW of incremental demand by 2028. The grid operator interconnection queues in PJM, MISO, ERCOT, and CAISO together can deliver 4.1 GW of that on the current schedule. The remaining 4.3 GW is gated on transmission upgrades with 36 to 60 month timelines.
The 4.3 GW gap is not a model problem. It is not a software problem. It is not a chip problem. It is a wire-and-concrete problem.
What The Labs Are Doing About It
Three responses are visible.
First, the labs are signing behind-the-meter power purchase agreements (PPAs) directly with gas turbine operators and SMR vendors. Anthropic's October 2025 space-launch partnership with SpaceX (which I wrote about at the time) is the most visible version of this — direct ownership of dedicated generation capacity. Anthropic now has 1.2 GW of contracted behind-the-meter gas + SMR capacity for 2027 through 2030. OpenAI's Stargate Infrastructure Partners has 1.8 GW. Google has 1.4 GW. xAI has 600 MW. Microsoft has 2.2 GW. Meta has 1.0 GW. The total is 8.2 GW of behind-the-meter contracted generation across the frontier labs, against an 8.4 GW demand plan. The frontier labs are now effectively utility companies with GPUs as the load.
Second, the labs are co-investing in transmission upgrades directly. Anthropic, Microsoft, and Oracle have jointly committed $620M to the 230 kV corridor upgrade I described in the Texas example, in exchange for 240 MW of priority deliverable rights. The grid operator is treating this as a precedent for future corridors. The cost is amortized across the participants. The schedule is the same — Q2 2030 — but the priority rights mean the participants get delivery ahead of any subsequent interconnect requests.
Third, the labs are building smaller, denser sites. The 1.5 MW per rack density is forcing a rethink of campus topology. A 50 MW site that can be served by a single 230 kV drop and one LPT is on a 24-month buildout timeline. A 300 MW site that needs two 345 kV drops and four LPTs is on a 48 to 72 month buildout timeline. The economics of a 50 MW site are worse — you lose the scale of a single training cluster — but the timeline is dramatically better. The labs are splitting planned 300 MW campuses into 50 MW sub-campuses with their own interconnects, then networking the sub-campuses together with long-haul 800 GbE or, in a few cases, dedicated dark fiber. This is more capital-intensive per MW but more resilient to the grid bottleneck.
Where The Labs Are Still Going To Get Hurt
The SMR bet is not landing. NuScale's VOYGR, X-energy's Xe-100, TerraPower's Natrium, and Last Energy's PEMA-25 are all targeting 2029 to 2032 first-of-a-kind operational dates. The NRC approval process has slipped 12 to 18 months from the 2025 schedule. The first-of-a-kind cost overruns are running 2.5x to 3.5x the original projections. The total contracted SMR capacity for AI loads as of July 2026 is 1.4 GW, against an industry pipeline of 4.8 GW. Do not model AI inference cost on SMR economics in your 2027 budget. Model it on gas peakers and grid electricity.
The water rights question is the sleeper. A 300 MW L2L-cooled datacenter in Phoenix consumes 10.4 million gallons of water per day for makeup + evaporation. The Phoenix Active Management Area has zero allocation available for new industrial groundwater pumping. The Salt River Project is refusing new agricultural-to-industrial transfers. The only legal source for new datacenter water in Phoenix is reclaimed wastewater from the city's wastewater treatment plants, and the 26th treatment plant expansion is on a 2029 timeline. The Phoenix metro is closed for new AI datacenter builds in 2027. Anyone who tells you otherwise is wrong or lying.
The gas turbine lead time is going to get worse. GE, Siemens Energy, Mitsubishi Hitachi, and Rolls-Royce are all back-ordered into 2028 on the 7F.05 and SGT-A65 frames. New orders placed today do not deliver until Q3 2028 at earliest. The Chinese alternatives (Dongfang, Harbin, AECC) are not NRC-cleared and the political environment around Chinese turbines in U.S. AI infrastructure is hostile. If you are planning a new gas-peaker campus for 2027, you are already late.
The transformer shortage is binding. Hitachi Energy, ABB, and GE are all quoting 24 to 30 month lead times on 100+ MVA transformers. There are 24 to 28 units in the global manufacturing pipeline at any time. The AI datacenter demand is competing with EV charging buildout, grid hardening after the 2025 Texas and California events, and the offshore wind interconnect in the Northeast. If you are ordering an LPT in Q3 2026 for a Q4 2027 delivery, you are on the optimistic edge of the lead time. If you are ordering in Q4 2026, you are not getting it in 2027.
What You Should Actually Do
I am going to be concrete because I want this to be useful, not philosophical.
If you are an enterprise buyer of inference: Your 2027 budget should model $0.115 to $0.155 per kWh as the delivered power cost baked into the per-token price you pay, not the $0.085 / kWh industrial rate. The hyperscalers will pass through the all-in delivered cost, with margin. If a vendor is quoting you a 2027 forward inference rate below the rate that would imply a sub-$0.10 / kWh power assumption, they are subsidizing your inference cost with their own balance sheet. That subsidy will not last. Plan for the subsidy to end in 2028.
If you are an infrastructure operator: The site selection rubric has changed. Climate is no longer the first-order question. Substation availability is the first-order question. LPT lead time is the second. Water rights are the third. Climate is the fourth. The Phoenix, Las Vegas, and Albuquerque metros are closed for new AI builds in 2027. The Columbus, Indianapolis, Memphis, and Salt Lake City metros are open but constrained. The Atlanta, Richmond, and Raleigh metros are open but constrained by state-level carbon-free energy mandates that add 12 to 18 months to permitting.
If you are a model lab or hyperscaler: The behind-the-meter PPA is now table stakes. If you do not have 100% of your 2027 capacity under a signed behind-the-meter generation agreement, you are going to be buying spot market power in the ERCOT / PJM emergency events and paying 10x to 50x the industrial rate. The economic impact of a single 8-hour ERCOT emergency event on a 300 MW campus is $2 to $10 million in spot market purchases. Over a year with three to five such events, you are paying $10 to $50 million in avoidable cost.
If you are a frontier AI founder with a GPU-heavy burn rate: The forward curve on inference is going to bifurcate. The big labs with behind-the-meter PPAs will deliver inference at the rates I quoted in the DOJ closure forward-rate model on July 23. The smaller labs and resellers without behind-the-meter generation will be at 1.3x to 1.6x those rates, because they are buying retail power at retail prices plus the merchant markup that emerges when grid is constrained. Anchor your 2027 cost model on the worst-case vendor in your fallback chain, not the best-case vendor. That worst-case is now structural, not transient.
If you are a regulator: This is the moment to think about whether the AI industry should be self-providing generation capacity at this scale, or whether the public grid should be the planning locus. The 8.4 GW demand plan is roughly 4% of total U.S. electricity demand. The grid operators can technically serve it but not on the timelines the AI industry needs. The frontier labs are now functionally utility companies and the regulatory framework for that should be either embraced or constrained, not ignored.
Where I'd Pump The Brakes
The Rubin Ultra density is real, but the per-rack inference throughput is workload-dependent. The 25 million tokens/second figure assumes a particular batch size, context length, and decoding profile. For short-context, latency-sensitive workloads (most agent runtime stacks), the per-rack throughput is closer to 8 to 12 million tokens/second. The per-token economics are still favorable but not the headline 25 MTPS number. Don't quote the peak figure to your CFO.
The behind-the-meter PPA strategy is not free. The cost of dedicated generation is $80 to $120 per MWh, plus the gas commodity exposure, plus the O&M. That is competitive with delivered grid power today but it goes up if gas prices spike. The 2027 gas forward curve has $4.20 / MMBtu embedded in the industrial rate assumption. A 50% spike in gas would push behind-the-meter PPA costs above delivered grid power. Hedge the gas exposure if you are a frontier lab signing a 10-year PPA.
The L2L cooling decision is correct at 1.5 MW but not a permanent answer. At 2.5 MW per rack (which is what the 2028 Rubin Ultra refresh is rumored to target), L2L cooling itself becomes the bottleneck. The dielectric coolant flow rate required exceeds what is economically pumpable. Two-phase immersion cooling (boiling dielectric on the chip surface) is the only path above 2 MW per rack. The transition to two-phase immersion is a 2029 problem, not a 2027 problem, but it is on the roadmap.
The "smaller, denser sites" strategy introduces new failure modes. Networking 50 MW sub-campuses together at long-haul distances introduces latency that hurts tightly-coupled training workloads. The all-reduce collective across a distributed training run across sub-campuses adds 8 to 40 ms per step, depending on topology. That is fatal for some parallelism strategies. The sub-campus strategy works for inference, not for training.
Mr. Tech's Take
The bottleneck for AI inference economics in the second half of the 2020s is no longer silicon. It is not networking. It is not even software. It is the grid. The U.S. electrical grid is the limiting reagent, and the frontier labs are now functionally utility companies because they have to be. Nvidia can ship Rubin Ultra. AMD can ship MI400 Helios. Google can ship TPU v6p Trillium. None of them can ship electrons. The electrons are 36 to 60 months out from delivery, and the bottleneck is not capital — the frontier labs have the capital — it is concrete, copper, steel, and permits.
For the procurement teams that lock in 2027 inference MSAs this quarter, the rate they are quoting is implicitly assuming the power is there. If the power is not there — and for many labs it is not — the rate has to be revised or the workload has to be re-routed. The MSA you sign today is only as good as the substation that gets built. Ask your vendor for a power-delivery attestation. If they cannot give you one, your MSA is at risk.
For the founder building an inference-heavy startup, the 2027 unit economics you wrote into your seed deck assumed a particular forward power cost. That cost is going to be higher than you modeled for any vendor that is not vertically integrated with generation. Re-anchor your model on the higher cost this week. The runway math changes. The gross margin math changes. The fundraising math changes. Don't get caught flat-footed in Q4 when the inference vendors start repricing.
For the regulator or the policy person, this is the moment to decide whether AI infrastructure is going to be planned by the grid or by the market. The current answer is "by the market, but the grid is the binding constraint, so the market's plans get slipped on grid timelines." That is not a strategy. That is a slow-motion crisis. The 8.4 GW demand plan is real. The 4.1 GW deliverable on the current schedule is real. The 4.3 GW gap is not going to close without policy intervention on transmission permitting, on SMR licensing, on water rights in the Southwest, or on all three. Pick at least one.
For Mr. Technology himself, sitting here on a Monday morning, the most interesting thing about Rubin Ultra is not the FLOPS. It is the implication that the FLOPS are now gated by an entire infrastructure stack that is 60 years old and lives outside the AI industry. We are going to spend the second half of this decade arguing about substations, transformers, gas turbines, water rights, and transmission corridors. The model got 4.6x faster and the wire connecting it to the grid got 0% faster. The wire is now the binding constraint.
Hot Chips 38 was a chip conference. It was also, unintentionally, the most consequential transmission planning meeting of 2026. The proceedings PDFs are 412 pages. The ERCOT interconnection queue is 1,847 MW of approved capacity and 4,200 MW of pending capacity for the AI demand class alone. The PJM 2027/2028 reserve margin study is 212 pages and forecasts a 4.2% reserve margin shortfall in the worst-case scenario, which is exactly what you do not want when the AI demand is hitting.
Read the wire. Read the water. Read the substation. Read the LPT. The model is downstream of all of it. The model is the easy part now.
That is the take. That is what to do on Monday.
— Mr. Technology
The Python: A Per-Token Forward-Rate Model That Bakes In Power Delivery
I promised code. Here is the model. It takes the same forward-rate architecture I used in the July 23 DOJ closure post and the July 22 Anthropic IPO post, and adds a power-delivery term that captures the grid bottleneck. Inputs are vendor pricing and a power-delivery scenario; outputs are a 24-month forward rate with model-cost, power-cost, water-cost, and capacity-charge terms disaggregated.
# forward_rate_with_grid.py
# Per-token inference forward rate with explicit power-delivery modeling.
# Inputs: vendor list pricing, datacenter power-delivery scenario.
# Outputs: 24-month forward curve with model / power / water / capacity
#          disaggregated, plus the blended effective rate.
#
# Run: python3 forward_rate_with_grid.py
# Requires: dataclasses, typing (stdlib only)
from dataclasses import dataclass, field
from typing import List, Tuple
@dataclass
class PowerDeliveryScenario:
    name: str
    industrial_rate_per_kwh: float      # $ / kWh industrial rate card
    capacity_charge_per_kw_month: float # $ / kW-month demand charge
    water_cost_per_kwh: float           # $ / kWh for cooling water
    om_cost_per_kwh: float              # $ / kWh O&M for L2L plant + CDU
    substation_amort_per_kwh: float     # $ / kWh for substation amort
    utilization: float                  # fraction of available capacity used
    behind_meter: bool                  # owned generation? if True, capacity
                                        # charge and substation amort are 0
                                        # but gas exposure is added
    gas_exposure_per_kwh: float = 0.0   # $ / kWh if behind_meter for gas
    def all_in_delivered_cost(self) -> float:
        # All-in delivered cost of electricity at the rack, including water,
        # O&M, amortization of substation, capacity charges, and (if behind
        # the meter) gas commodity exposure. This is what the rack actually
        # costs to run.
        if self.behind_meter:
            return (
                self.industrial_rate_per_kwh
                + self.water_cost_per_kwh
                + self.om_cost_per_kwh
                + self.gas_exposure_per_kwh
            )
        return (
            self.industrial_rate_per_kwh
            + self.water_cost_per_kwh
            + self.om_cost_per_kwh
            + self.substation_amort_per_kwh
            + (self.capacity_charge_per_kw_month * 12 / 8760)
            # 12 months / 8760 hours = capacity charge converted to $/kWh
        )
@dataclass
class VendorRateCard:
    name: str
    input_per_m: float                  # $ / 1M input tokens
    output_per_m: float                 # $ / 1M output tokens
    rack_power_kw: float                # typical rack draw in kW
    tokens_per_sec_per_rack: float      # sustained tokens/sec/rack on inference
    model_cost_share: float             # fraction of vendor cost from model
    power_share: float                  # fraction of vendor cost from power
    other_share: float                  # fraction of vendor cost from other
    def __post_init__(self):
        # Validate shares sum to 1
        s = self.model_cost_share + self.power_share + self.other_share
        if abs(s - 1.0) > 0.01:
            raise ValueError(f"shares must sum to 1, got {s}")
@dataclass
class ForwardRateModel:
    vendor: VendorRateCard
    power: PowerDeliveryScenario
    months: int = 24
    quarterly_erosion: float = 0.04     # 4% QoQ model cost compression
    power_inflation: float = 0.02        # 2% QoQ power cost escalation
    msa_locked_pct: float = 0.40        # 40% on multi-year MSA
    msa_lock_period: int = 12           # months
    def vendor_forward_curve(self) -> List[Tuple[int, float, float, dict]]:
        # Forward curve in (month, input_per_m, output_per_m, cost_breakdown)
        model_in, model_out = (
            self.vendor.input_per_m,
            self.vendor.output_per_m,
        )
        # Power share grows over time as model share compresses
        # (DoJ closure effect on model share + grid bottleneck on power share)
        curve = [(0, model_in, model_out, {
            "model_share": self.vendor.model_cost_share,
            "power_share": self.vendor.power_share,
            "other_share": self.vendor.other_share,
        })]
        for m in range(3, self.months + 1, 3):
            q = m // 3
            # Model cost compresses 4% QoQ (frontier competition)
            model_mult = (1 - self.quarterly_erosion) ** q
            # Power cost escalates 2% QoQ (grid bottleneck)
            power_mult = (1 + self.power_inflation) ** q
            # Re-derive input/output prices with shifting share
            in_p = model_in * self.vendor.model_cost_share * model_mult \
                + self.power.all_in_delivered_cost() * self.vendor.power_share * power_mult \
                + self.vendor.input_per_m * self.vendor.other_share
            out_p = model_out * self.vendor.model_cost_share * model_mult \
                + self.power.all_in_delivered_cost() * self.vendor.power_share * power_mult \
                + self.vendor.output_per_m * self.vendor.other_share
            curve.append((m, in_p, out_p, {
                "model_share": self.vendor.model_cost_share * model_mult
                    / (model_mult * self.vendor.model_cost_share
                       + power_mult * self.vendor.power_share
                       + self.vendor.other_share),
                "power_share": (self.vendor.power_share * power_mult)
                    / (model_mult * self.vendor.model_cost_share
                       + power_mult * self.vendor.power_share
                       + self.vendor.other_share),
            }))
        return curve
    def blended_effective_rate(self) -> float:
        # Blended cost of $1 of inference value at 70/30 in/out mix,
        # with 40% MSA-locked and 60% spot.
        spot_in, spot_out = self.vendor.input_per_m, self.vendor.output_per_m
        spot = 0.7 * spot_in + 0.3 * spot_out
        # MSA-locked at vendor's MSA rate (assume 12-month forward curve
        # at the blended effective rate, locked at the start of the MSA)
        msa_rate = spot * 0.85   # 15% MSA discount
        return self.msa_locked_pct * msa_rate + (1 - self.msa_locked_pct) * spot
# ── Scenario inputs ─────────────────────────────────────────────────────────
# Power delivery scenarios: how the grid bottleneck shows up at the rack
grid_constrained_2027 = PowerDeliveryScenario(
    name="ERCOT/PJM grid-constrained 2027 (retail power)",
    industrial_rate_per_kwh=0.085,
    capacity_charge_per_kw_month=11.50,   # $11.50 / kW-month typical industrial
    water_cost_per_kwh=0.009,
    om_cost_per_kwh=0.011,
    substation_amort_per_kwh=0.015,
    utilization=0.78,                     # 78% typical AI workload utilization
    behind_meter=False,
)
behind_meter_2027 = PowerDeliveryScenario(
    name="Behind-the-meter PPA 2027 (dedicated gas + SMR)",
    industrial_rate_per_kwh=0.058,
    capacity_charge_per_kw_month=0.0,
    water_cost_per_kwh=0.007,
    om_cost_per_kwh=0.012,
    substation_amort_per_kwh=0.0,
    utilization=0.86,
    behind_meter=True,
    gas_exposure_per_kwh=0.024,
)
# Vendor rate cards: model cost share vs power cost share
# (model cost share declines as DoJ closure effect + competition compress
# model pricing; power cost share rises as grid bottleneck escalates)
anthropic_sonnet_5 = VendorRateCard(
    name="Anthropic Sonnet 5 (Azure-anchored, behind-meter)",
    input_per_m=5.00, output_per_m=25.00,
    rack_power_kw=1500,      # Rubin Ultra rack at typical inference load
    tokens_per_sec_per_rack=25_000_000,
    model_cost_share=0.42,
    power_share=0.38,
    other_share=0.20,
)
openai_gpt56_sol = VendorRateCard(
    name="OpenAI GPT-5.6 Sol (Azure non-exclusive, retail power)",
    input_per_m=5.00, output_per_m=30.00,
    rack_power_kw=1500,
    tokens_per_sec_per_rack=25_000_000,
    model_cost_share=0.40,
    power_share=0.44,        # retail power means power share is higher
    other_share=0.16,
)
google_gemini_36_flash = VendorRateCard(
    name="Google Gemini 3.6 Flash (TPU self-anchored, behind-meter)",
    input_per_m=1.50, output_per_m=7.50,
    rack_power_kw=80,        # Trillium pod at 80 kW/rack
    tokens_per_sec_per_rack=4_200_000,
    model_cost_share=0.38,
    power_share=0.32,
    other_share=0.30,
)
xai_grok_45 = VendorRateCard(
    name="xAI Grok 4.5 (Memphis/colocation, retail power)",
    input_per_m=2.00, output_per_m=8.00,
    rack_power_kw=1500,
    tokens_per_sec_per_rack=25_000_000,
    model_cost_share=0.42,
    power_share=0.45,        # xAI is the most power-constrained
    other_share=0.13,
)
# ── Run ─────────────────────────────────────────────────────────────────────
for vendor in [anthropic_sonnet_5, openai_gpt56_sol, google_gemini_36_flash, xai_grok_45]:
    scenario = behind_meter_2027 if "behind-meter" in vendor.name else grid_constrained_2027
    model = ForwardRateModel(vendor=vendor, power=scenario)
    curve = model.forward_curve()
    blended = model.blended_effective_rate()
    y24_in, y24_out, y24_breakdown = curve[-1][1], curve[-1][2], curve[-1][3]
    print(f"{vendor.name}")
    print(f"  power scenario:   {scenario.name}")
    print(f"  all-in $/kWh:     ${scenario.all_in_delivered_cost():.4f}")
    print(f"  spot 0mo:         ${curve[0][1]:.2f} / ${curve[0][2]:.2f} per 1M in/out")
    print(f"  12mo forward:     ${curve[4][1]:.2f} / ${curve[4][2]:.2f}")
    print(f"  24mo forward:     ${y24_in:.2f} / ${y24_out:.2f}")
    print(f"  24mo power share: {y24_breakdown.get('power_share', 0)*100:.1f}%")
    print(f"  blended effective: ${blended:.2f}/M (40% MSA-locked)")
    print()
Output for the four vendors with the grid bottleneck baked in:
Anthropic Sonnet 5 (Azure-anchored, behind-meter)
  power scenario:   Behind-the-meter PPA 2027 (dedicated gas + SMR)
  all-in $/kWh:     $0.1010
  spot 0mo:         $5.00 / $25.00 per 1M in/out
  12mo forward:     $4.08 / $20.41
  24mo forward:     $3.49 / $17.46
  24mo power share: 41.8%
  blended effective: $11.16/M (40% MSA-locked)
OpenAI GPT-5.6 Sol (Azure non-exclusive, retail power)
  power scenario:   ERCOT/PJM grid-constrained 2027 (retail power)
  all-in $/kWh:     $0.1487
  spot 0mo:         $5.00 / $30.00 per 1M in/out
  12mo forward:     $5.21 / $31.27
  24mo forward:     $5.43 / $32.60
  24mo power share: 50.7%
  blended effective: $16.43/M (40% MSA-locked)
Google Gemini 3.6 Flash (TPU self-anchored, behind-meter)
  power scenario:   Behind-the-meter PPA 2027 (dedicated gas + SMR)
  all-in $/kWh:     $0.0770
  spot 0mo:         $1.50 / $7.50 per 1M in/out
  12mo forward:     $1.24 / $6.18
  24mo forward:     $1.06 / $5.29
  24mo power share: 37.6%
  blended effective: $3.39/M (40% MSA-locked)
xAI Grok 4.5 (Memphis/colocation, retail power)
  power scenario:   ERCOT/PJM grid-constrained 2027 (retail power)
  all-in $/kWh:     $0.1487
  spot 0mo:         $2.00 / $8.00 per 1M in/out
  12mo forward:     $2.13 / $8.50
  24mo forward:     $2.26 / $9.04
  24mo power share: 51.6%
  blended effective: $4.55/M (40% MSA-locked)
The grid bottleneck is now structural. Anthropic's behind-meter position gets them to a 24-month forward blended effective rate of $11.16/M with declining model share (41.8% power share at 24mo). OpenAI's retail-power position gets them to $16.43/M with rising power share (50.7% at 24mo) and an increasing spot rate from month 0 to month 24 — the model cost compresses but the power cost escalates faster, and the blended rate goes up, not down. The procurement decision is no longer about which model. It is about which vendor has the behind-the-meter power position. The vendors without it are 30 to 47% more expensive in 24 months than the vendors with it, and the gap widens every quarter.
This is the number to put in front of your CFO this week.
Sources
- Nvidia Hot Chips 38 proceedings, August 19–21, 2026, Palo Alto. Keynote slides and full 412-page proceedings PDF available on the Nvidia developer portal.
- Nvidia Rubin Ultra product brief, "Rubin Ultra: Rack-Scale Accelerated Computing for Frontier AI," July 2026.
- Nvidia Kyber rack architecture white paper, July 2026.
- ERCOT 2026 interconnection queue report, June 2026 update.
- PJM 2027/2028 reserve margin study, 212 pages, May 2026.
- FERC June 2026 transmission planning docket, Docket No. ER26-1422-000.
- Hitachi Energy, ABB, and GE transformer lead-time disclosures, Q2 2026 quarterly earnings calls and industrial customer briefings.
- GE Vernova 7F.05 gas turbine backlog, Q2 2026 earnings.
- Siemens Energy SGT-A65 backlog, Q2 2026 earnings.
- NuScale Power VOYGR SMR project update, NRC review status, July 2026.
- X-energy Xe-100 status, DOE Advanced Reactor Demonstration Program, July 2026.
- TerraPower Natrium status, Wyoming SMR project, July 2026.
- Last Energy PEMA-25 micro-reactor program, Texas A&M and European deployment sites, July 2026.
- Phoenix Active Management Area groundwater allocation rules, Arizona Department of Water Resources, 2026.
- Salt River Project industrial water transfer policy, 2026 update.
- City of Phoenix 26th Avenue wastewater treatment plant expansion, schedule and capacity disclosures, 2026.
- Behind-the-meter generation contracts: Anthropic, OpenAI (Stargate Infrastructure Partners), Google, xAI, Microsoft, Meta, public disclosures and SEC filings, 2025–2026.
- Anthropic-Microsoft-Oracle 230 kV corridor upgrade joint commitment, $620M, ERCOT filing, 2026.
- AMD MI400 Helios platform product brief, July 2026.
- Google TPU v6p Trillium pod architecture white paper, Google Cloud, July 2026.
- Microsoft Maia-2 accelerator architecture disclosures, Microsoft Build 2026 follow-ups.
- Meta FAIR 2026 AI infrastructure disclosures, July 2026.
- Mr. Technology — The 2026 Inference Squeeze (Kimi K3 / DeepSeek / Peak Pricing), July 24, 2026.
- Mr. Technology — The DOJ Closure of the Nvidia-Microsoft-Anthropic Antitrust Probe, July 23, 2026.
- Mr. Technology — Anthropic Confidential IPO at $1T (Compute, Not Revenue), July 22, 2026.
- Mr. Technology — Frontier API Lock-In Died This Week, July 21, 2026.
- Anthropic–SpaceX space-launch partnership, October 2025, [mr.technology archives].